Core Technologies
D3.js - Data-Driven SVG Visualization
D3.js stands for "Data-Driven Documents". Its core feature is "data-driven", which can dynamically generate, update, and remove visual elements (SVG) based on data changes. This means that every chart, graph, or interaction can directly reflect real-time changes in the underlying data.
For general OrbCharts users, you will not directly use D3.js's API, as it is only used internally in OrbCharts's drawing functions.
RxJS - Observable Streams
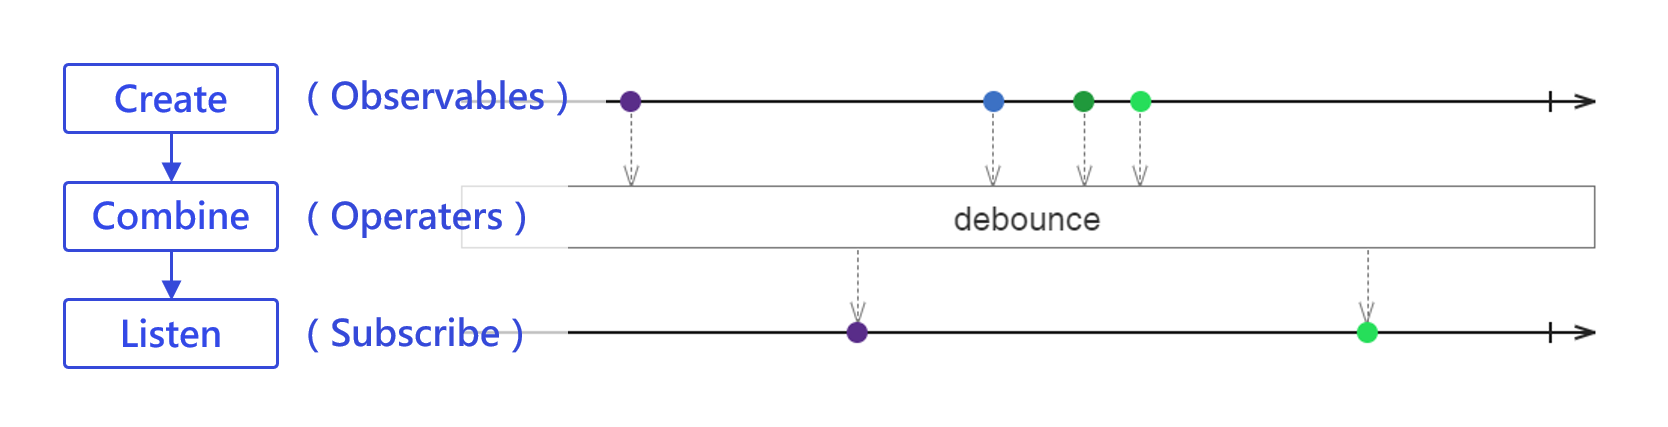
OrbCharts uses RxJS internally to handle data streams. The main APIs on OrbCharts's chart objects and Plugin objects are also RxJS Observable. If you know some RxJS syntax, you can use RxJS to perform advanced operations on OrbCharts charts, but this is not necessary.
If you have not learned RxJS, the syntax introduced below may seem unfamiliar. However, don't worry, you don't need to understand its background knowledge and working principles. You only need to know the two types of syntax we will use, and you can even treat them as regular functions.
Basically, there are only the following two types of syntax:
- Passing Data
chart.chartParams$.next(PARAMS)
Here, chartParams$ is one of the APIs, and .next() is the syntax for passing data using this API. The syntax for passing data to other APIs is the same.
- Subscribing to Events
chart.event$.subscribe(data => {
  console.log(data)
})
Here, event$ is an API object, and subscribe is the syntax for subscribing to this object. You can treat it as a regular callback function.
It is mainly used for listening to mouse events (mouse enter, leave, click, etc.) and obtaining the corresponding data on elements.
TIP
For easier understanding, the terms used above may not be very accurate. If converted to RxJS terms, it would be better to say:
- Create a new data stream (Observable)
- Subscribe to the data stream (Observable)
Data-Driven Chart Design
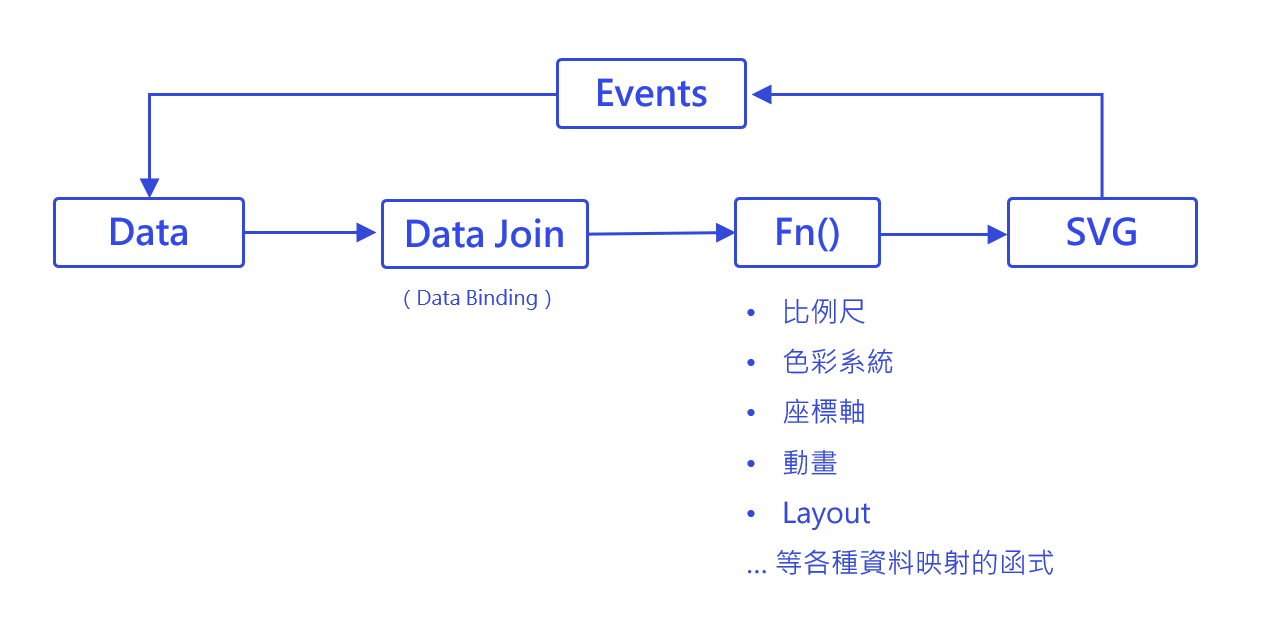
OrbCharts uses D3.js and RxJS as its underlying technologies. Combining them, we can draw a simple flowchart like the one above (conceptual, not very precise).
Ideally, using D3.js's "data-driven" technology, we can perfectly map data to drawing elements. However, OrbCharts provides a large number of parameters, and any change in these parameters will trigger internal drawing functions, causing a lot of repeated calculations.
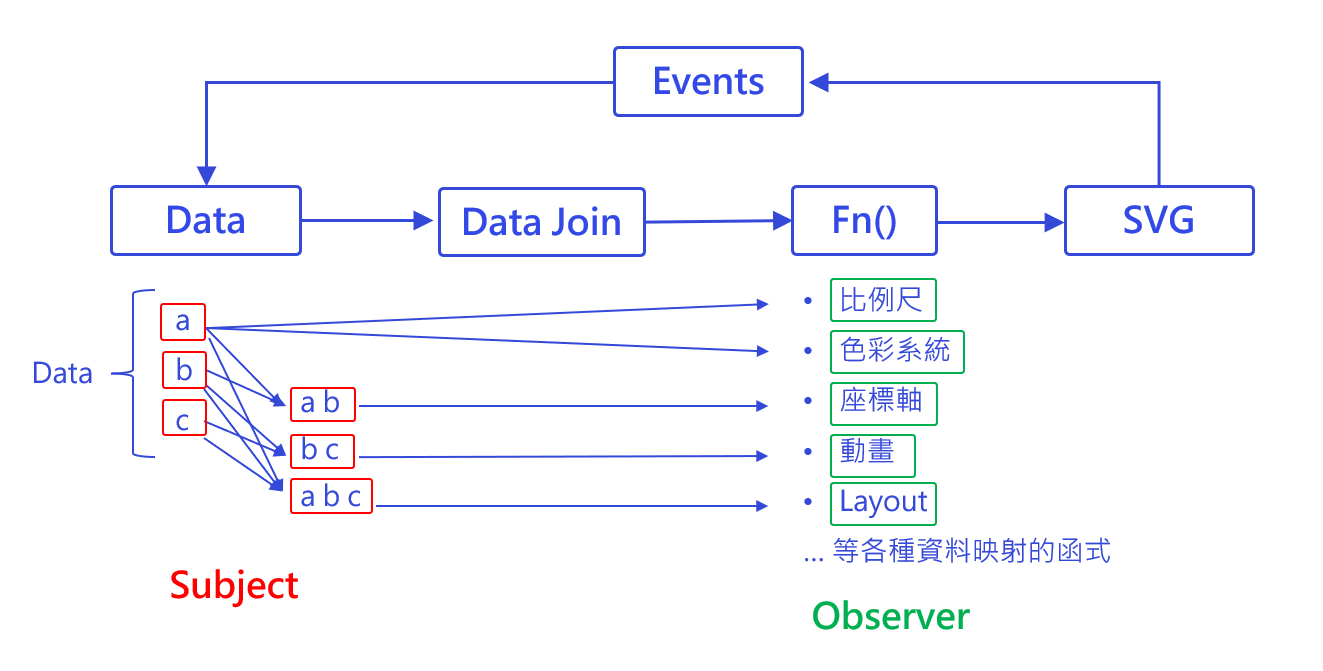
Using RxJS solves this problem - by using the observer pattern, we can minimize the calculations to only the changed data.